

Our theme for the equity market as we approached 2023 was: 2023 is likely to be the inverse of 2022. We’re deeply gratified that this became reality. Unlike many, we expected solid results for stocks this past year, and that is exactly what investors got. This cheer came on the heels of 2022, which saw a peak-to-trough decline in the S&P 500 of 22% due to misplaced anticipation of an economic recession and a sharp downdraft in earnings in 2023.1 Neither came to pass. Hence, to the surprise of many, a sharp recovery in stocks played out in 2023, with the S&P 500 advancing over 26%.2 Hopefully, investors embraced our message not to run away from stocks in 2023 but instead to maintain equity allocations at their normal, long-term targeted levels.
Impressively, the market’s advance gained momentum and broadened as the year approached its close. Specifically, the S&P 500’s 16% surge off the October 2023 low is one of the strongest rallies on record following a 10%+ correction in the market similar to what occurred between July 31 and October 27. The S&P 500 fell from a year-to-date high price level at the time of 4,588 on July 31 down to 4,137 on October 27. The Index then rebounded to a new 2023 high of 4,769 on December 29, which made for a spectacular finish. November and December returns were outstanding, with monthly gains of over 9% and 4%, respectively.3 The nine-straight weeks of market gains posted in this two-month period is the longest consecutive positive streak recorded since 2004. This was quite the Santa Claus rally.
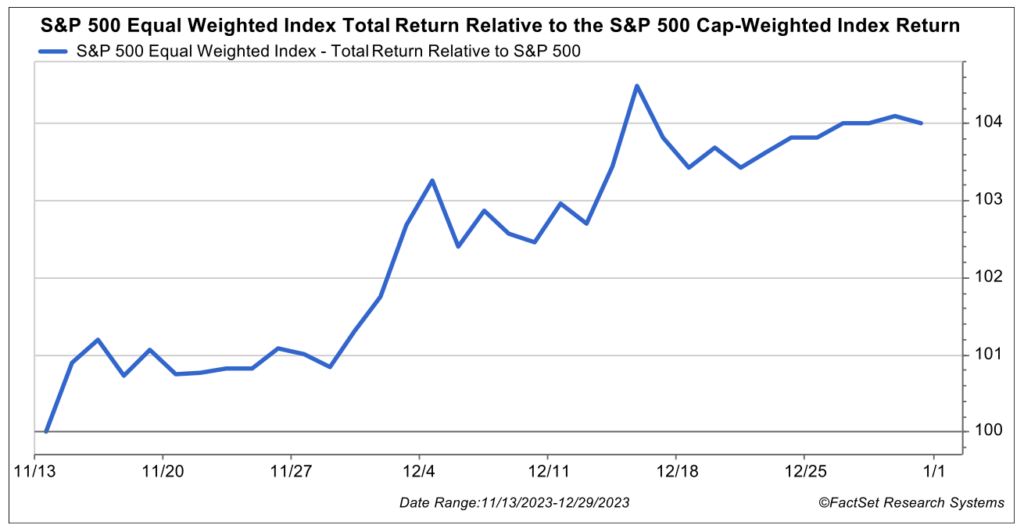
Whereas the first 10 months of the year were largely driven by just a handful of stocks, known as the “Magnificent 7” (Alphabet, Amazon, Apple, Meta, Microsoft, Nvidia, Tesla), these final two months of the year saw far more participation on the part of the other 493 stocks in the S&P 500 in terms of contribution to the return of this index. This is probably best illustrated by the significant outperformance of the equally weighted S&P 500 versus the market-cap-weighted index during this time frame.
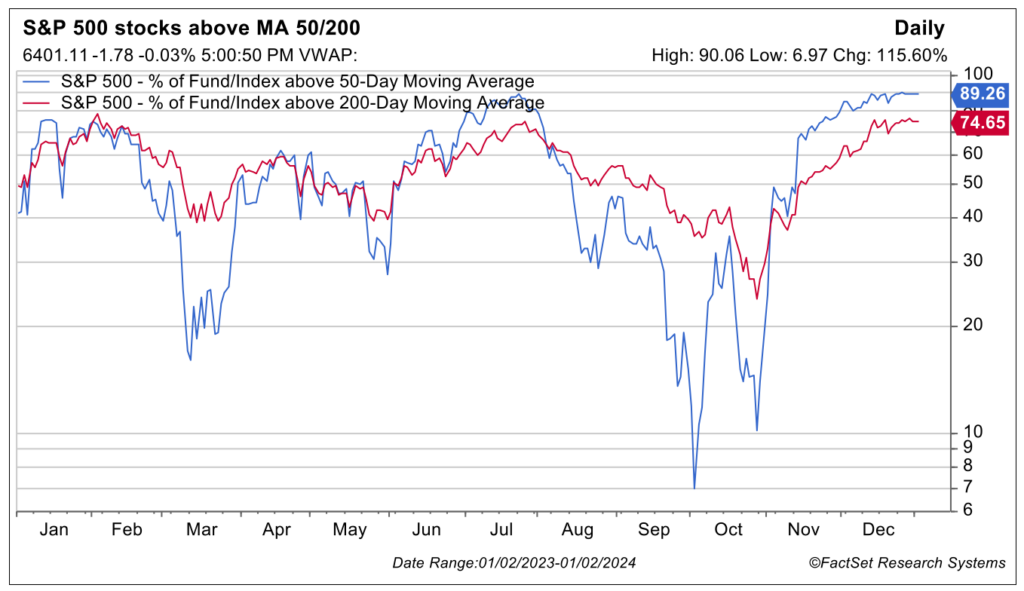
However, there have been many other signs of a broadening in leadership in the equity markets, which is heartening. It serves as a good sign for further advancement in 2024 and for opportunities via active stock selection. These signals of a broadening in leadership and participation in positive returns include:
- Significant improvement in the percentage of stocks trading above their 50-day and 200-day moving average.
- High-beta stocks outperforming low-beta stocks in the final months of 2023.
- Value outperforming growth recently versus the opposite scenario earlier in the year.
- A larger number of sectors and industry groups outperforming the overall S&P 500.
- Small-cap stocks outperforming large caps at year-end and making a valiant run as the year came to a close.
WAS THE 2023 RALLY REAL OR A BUBBLE?
Again, we have been a rare voice going back to January of 2023 in the belief that the healthy returns last year were real and deserved, not castle-in-the-sky in nature. The bear camp predicted a major stock market meltdown for 2023 based on expected recessionary conditions and an associated slide in earnings. We looked at things differently, recognizing that the stock market and the economy are not one and the same. The former moves in advance of the latter. The 22% peak-to-trough decline in the S&P 500 in 2022 occurred in advance of/in anticipation of economic weakness in 2023. While we agreed there was a 50-50 chance of recession in 2023, using history as one guide, the pain in the stock market already occurred in 2022. We know that the market often rises in the midst of a recession because stock investors exit positions in advance of them. We saw upside in 2023 for that reason alone, even if a mild recession developed. However, when we looked at the fundamental economic and earnings picture going into the year, it didn’t look bad to us. Yes, there were quite a few wall of worry issues out there, ranging from elevated inflation to concerns about debt ceiling debates and geopolitics. Nevertheless, we believed news would develop in better-than-feared fashion, as the U.S. economy and earnings looked remarkably resilient, much to the chagrin of the more bearish-inclined.
As suggested in the theme we laid out above that 2023 was likely to be the inverse of 2022, the year went exactly according to game plan, in our view, even if we had rare company in this positive thinking. We simply believed investors had become far too negative about both the economy and stock market fundamentals going into the year. We also believed the S&P 500 could advance handsomely as subsequent data releases throughout 2023 could prove that financial conditions were solid after all.
MARKET METRICS ARE POSITIVE
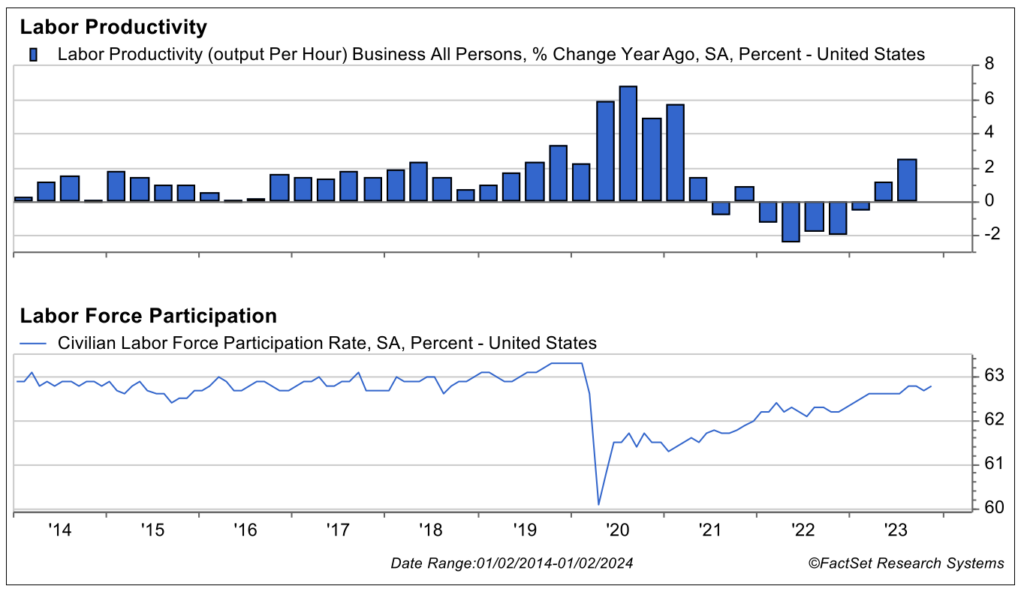
The metrics did just that. Employment figures have continued to be healthy, with low unemployment and wages growing at a steady clip. More people are entering the workforce as indicated by the steady increase in the labor force participation rate. There is also a surprisingly strong increase in labor productivity linked to artificial intelligence and related advances in technology. The boost in labor productivity is also linked to a declining quit rate by workers. In addition, more experience on the job has resulted in higher output per hours worked. All these factors are driving solid consumer spending and contributing to a reacceleration in profit margins and earnings.
Several other noteworthy levers are driving growth, making this market rally real and giving it legs. Capital spending is stronger than expected. An unappreciated boom in capital investment is underway. These factors are inspired by companies’ desire to reshore and nearshore to address supply chain and national security issues. Significant legislation is supporting capital spending to fund infrastructure, plants and related equipment along with technology.
All of this is happening while inflation is calming and rates are settling in at higher, yet more normal and healthy, levels. The Federal Reserve is also suggesting it wants to cut rates next year. The mere thought that these positive trends would develop were hard to believe for some only a couple of months ago. Not to us—these were base-case assumptions based on the real-time trend in the data.
Bottom line, earnings grew slightly this year rather than catastrophically declining. Real gross domestic product (GDP) expanded well over 2% for the year and by more than 4% in the third quarter,4 which are hardly the recessionary conditions trumpeted by consensus thinking. This, coupled with an improving outlook on the inflation and Fed policy front, is a nice cocktail for respectable stock returns last year and in 2024.
WHAT’S NEXT FOR THE MARKET?
Many are probably asking, “Can the market do well going forward, after a spectacular 2023 and surge in momentum during the holiday season?” As we examine historical data, the answer is yes. The chart below illustrates that the market has exhibited extreme levels of strength and momentum this past month, with 77% of stocks trading above their 20-day moving average. Historically, this is a mild sign of caution for performance in the upcoming couple of months and suggests near-term temporarily overbought conditions. That said, the chart demonstrates when this kind of month-long strength has been exhibited in the past, it bodes quite well for the upcoming 12 months.
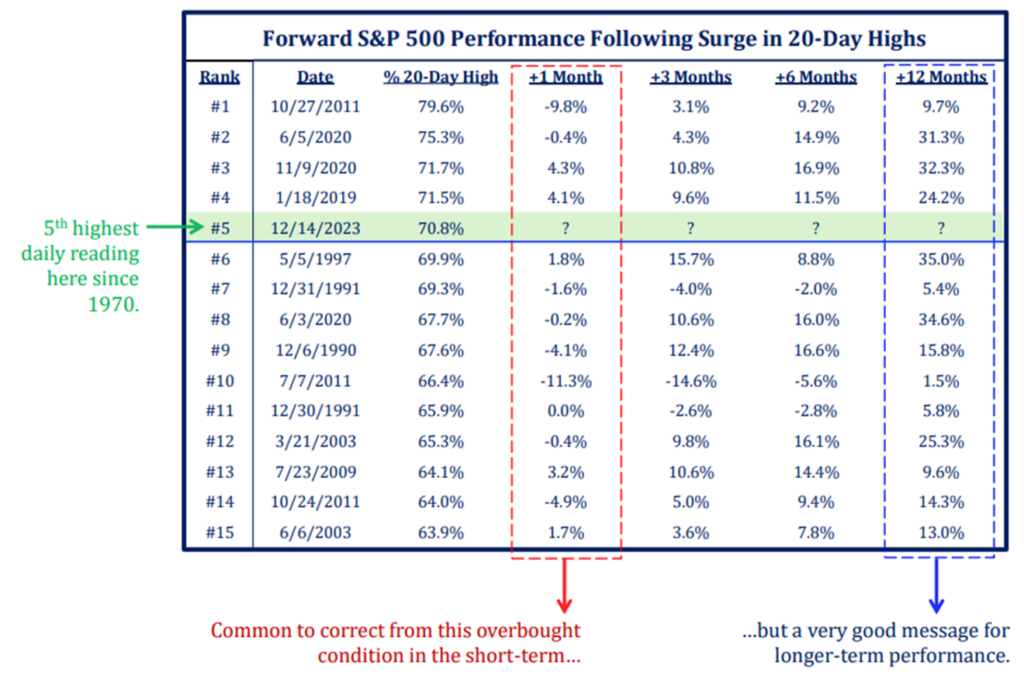
Source: Strategas
OUR THEME FOR 2024 IS: RETURN TO NORMAL
We’ll be presenting our 2024 Crystal Ball Outlook webinar January 25 and are saving details in regard to our expectations for 2024 for that time. Suffice it to say now that our theme for this year should be a comforting one. Perhaps it’s not overly exciting, but it incorporates a healthy, positive outlook. Some suggest that Fed policy has been reckless and unprecedented in its magnitude of restrictive action. Some believe the interest rate surge back to the 4% level or thereabouts on the 10-year Treasury is frightening for stocks. Some believe that inflation rates going back to the 2.5% to 3% level is unsettling.
We think the trend in these metrics is quite normal and healthy, as is the trend in earnings. What was unprecedented was a federal funds rate of 0% for a decade or more. All that the Fed has done is taken the federal funds rate back to normal levels. It did this following improving economic conditions after the 2007/2008 housing implosion, banking crisis and pandemic. The pandemic created a transitory spike in inflation that needed to be addressed. Same with the 10-year Treasury rate. The long-term average for the 10-year Treasury dating back to the late 1800s is 4.75%.5 We’ve simply moved back toward more normal levels on this front wherein fixed income investors can finally generate solid/more normal annual income again from bond positions. Isn’t this good news, especially for retired individuals?
We look for normal levels of inflation, more normal levels of intermediate-bond yields and more normal rates of growth in earnings in 2024. In other words, back to normal.
Maintaining current reasonable price-to-earnings (P/E) levels on consensus earnings takes us to a base-case target of 5,100 for the S&P 500 in 2024. This equates to a 7% price return for large-cap U.S. stocks and a roughly 9% total return as the most likely case, in our view. Returns are likely to come from normal, steady earnings growth this year rather than from P/E expansion in 2024. We’ll be sharing a more comprehensive discussion on this topic, as well as key risk factors we’ll be watching this year, in our upcoming 2024 Crystal Ball Outlook webinar. Information on how to register is included in this newsletter.
Happy New Year. It’s a privilege to serve you!
Source:
1,2,3FactSet
4FactSet, Bureau of Economic Analysis data
5Yardeni Research
The S&P 500 Index is a market capitalization-weighted index of 500 stocks designed to represent the performance of the leading industries in the United States economy chosen for market size and industry group representation. S&P 500 Equal Weight Index is designed to track the equally weighted performance of the 500 constituents in the S&P 500 Index. The indexes mentioned herein are unmanaged and cannot be directly invested into. Past performance is no indication of future results. Investing involves risk and the potential to lose principal.
This commentary is for informational and educational purposes only. The views expressed are for commentary purposes only and do not take into account any individual personal, financial, or tax considerations. As such, the information contained herein is not intended to be personal legal, investment, or tax advice or a solicitation to buy or sell any security or engage in a particular investment strategy. Nothing herein should be relied upon as such, and there is no guarantee that any claims made will come to pass.
Any opinions and forecasts contained herein are based on the information and sources of information deemed to be reliable, but we do not warrant the accuracy of the information that any opinion or forecast is based upon. You should note that the materials are provided “as is” without any express or implied warranties. Opinions expressed are subject to change without notice and are not intended as investment advice or to predict future performance. Actual results or developments may differ materially from those projected. Consult your financial professional before making any investment decision.
Mariner Advisor Network is a brand utilized by Mariner Independent Advisor Network (“MIAN”) and Mariner Platform Solutions (“MPS”). Investment advisory services are offered through Investment Adviser Representatives registered with MIAN or MPS, each an SEC registered investment adviser. Registration as an investment adviser does not imply a certain level of skill or training. MIAN and MPS comply with the current notice filing requirements imposed upon registered investment advisers by those states where they transact business and maintain clients. MIAN and MPS have either filed notice or qualify for an exemption or exclusion from notice filing requirements in those states. Any subsequent, direct communication by MIAN or MPS with a prospective client shall be conducted by a representative that is either registered or qualifies for an exemption or exclusion from registration in the state where the prospective client resides. For additional information about MIAN or MPS, including fees and services, please contact MIAN/MPS or refer to the Investment Adviser Public Disclosure website (www.adviserinfo.sec.gov). Please read the disclosure statement carefully before you invest or send money.
For information about which firm your advisor is registered with, please refer to the Investment Adviser Public Disclosure website (www.adviserinfo.sec.gov) or the Form ADV 2B provided by your advisor.
Investment Adviser Representatives are independent contractors of MPS or MIAN and generally maintain or affiliate with a separate business entity through which they market their services. The separate business entity is not owned, controlled by, or affiliated with MPS or MIAN and is not registered with the SEC. Please refer to the disclosure statement of MPS or MIAN for additional information.